We love GTFS: open, universal transit data for planning
filed under:
Planners at PSRC often look to our group to answer seemingly straightforward questions that turn out to be a little more nuanced to answer correctly. Here is a recent example posed by a colleague:
“Which bus routes in the region satisfy the following criteria?”
- Seven-day a week service
- At least 15 minute headways during peak and midday on the weekdays
- At least 30 minute headways on weekends
- Span of service runs from morning to evening.
Until recently, the difficulties of answering this query lay not with the analysis itself, but with acquiring the data and wrangling it to suit our needs. Despite building detailed transit networks for our travel demand model, we only represent an AM peak and Midday off-peak time period and we don’t have service data for the weekend. Plus, our base year network is from 2010, so that pretty much ruled it out as a data source. Another issue is that we have no less than seven different transit agencies in the region, each with their own network and scheduling databases.
GTFS
Enter the General Transit Feed Specification, or GTFS for short. Put simply, GTFS is a way for transit agencies to make their data publically available in a standardized format. Every GTFS dataset has the exact same schema, or structure; meaning you will always find, for example, a routes.txt table with route_id, route_short_name, route_long_name, route_desc and route_type fields.
Hence, if you write an application or script that uses a GTFS dataset from one agency, it should work with any other agency’s dataset too. If you ever wondered where your favorite transit app gets its data from, chances are high that it comes from GTFS and its real-time counterpart, GTFS-real-time. You can learn more here:
- GTFS Developer Page: https://developers.google.com/transit/gtfs
Using GTFS for analysis
Now that we have the data we need to answer the above question, how do we go about it? One issue is that individual routes often have several permutations that could include both directional characteristics and different service types, such as express and local. So it is entirely possible that some stops that serve a particular route do indeed have headways that meet the criteria, and some that don’t.
The solution? Look at the headways for each route at the stop level: if a route maintains the aforementioned headway/level of service criteria for some (high) percentage of its stops in both directions, then it satisfies the criteria.
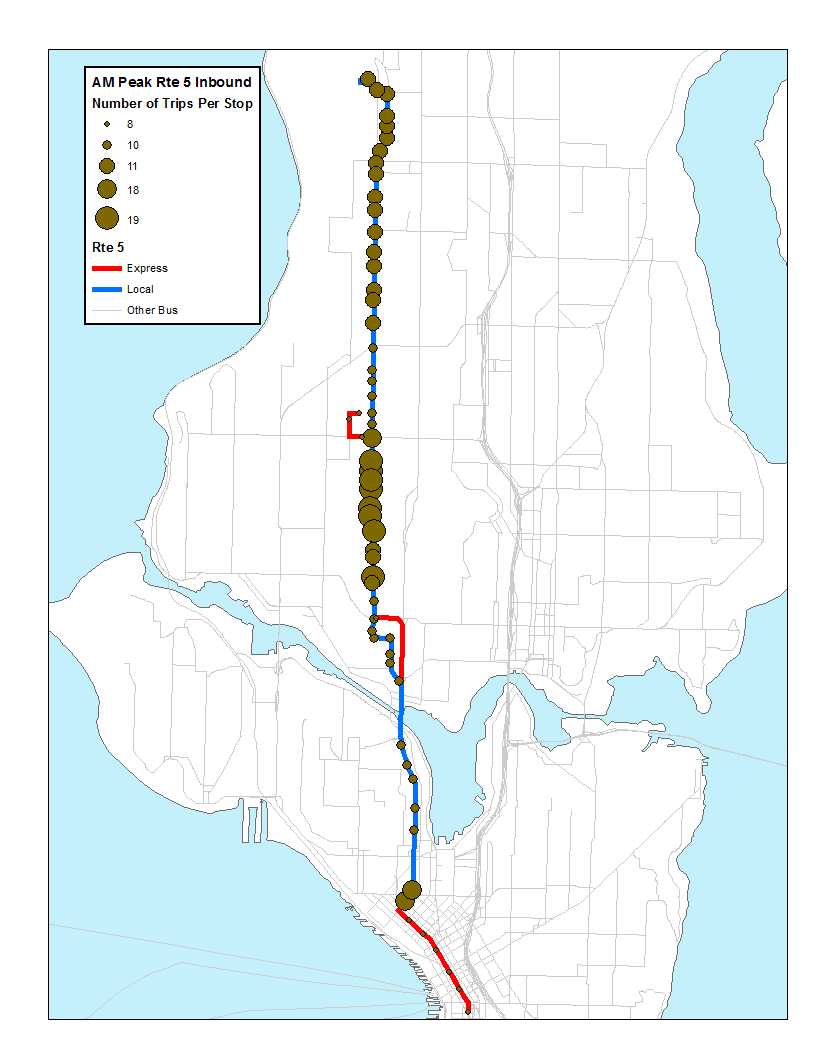 Frequency of Service by Stop: AM Peak Metro Route 5 Source: PSRC, Better Bus Buffers |
Now that we have the data and a reasonable way to answer the question, it’s time to figure out how to process the data. I found a great site for GIS tools for GTFS: transit.melindamorang.com. I took a look at the BetterBusBuffers tools there and it seemed like it might have what I was looking for, so I started playing with it in ArcMap. As it turns out, the ‘Count Trips for Individual Route’ tool was very close to what I needed, except it only processes one route at a time and I needed to run the analysis on hundreds of routes.
In the end, I borrowed heavily (Thanks Melinda!) from the BetterBusBuffers Python code and tweaked it to create a Pandas DataFrame, where each row represented a directional route’s stop and the number of times each stop was used for a given time window (e.g. 6-9 AM). Using this DataFrame (a table, essentially) I ran summary functions, grouping the data by directional route and was able to come up with a list of routes that satisfied the question rather quickly. The results helped create the ‘Frequent Bus’ layer in the map below.
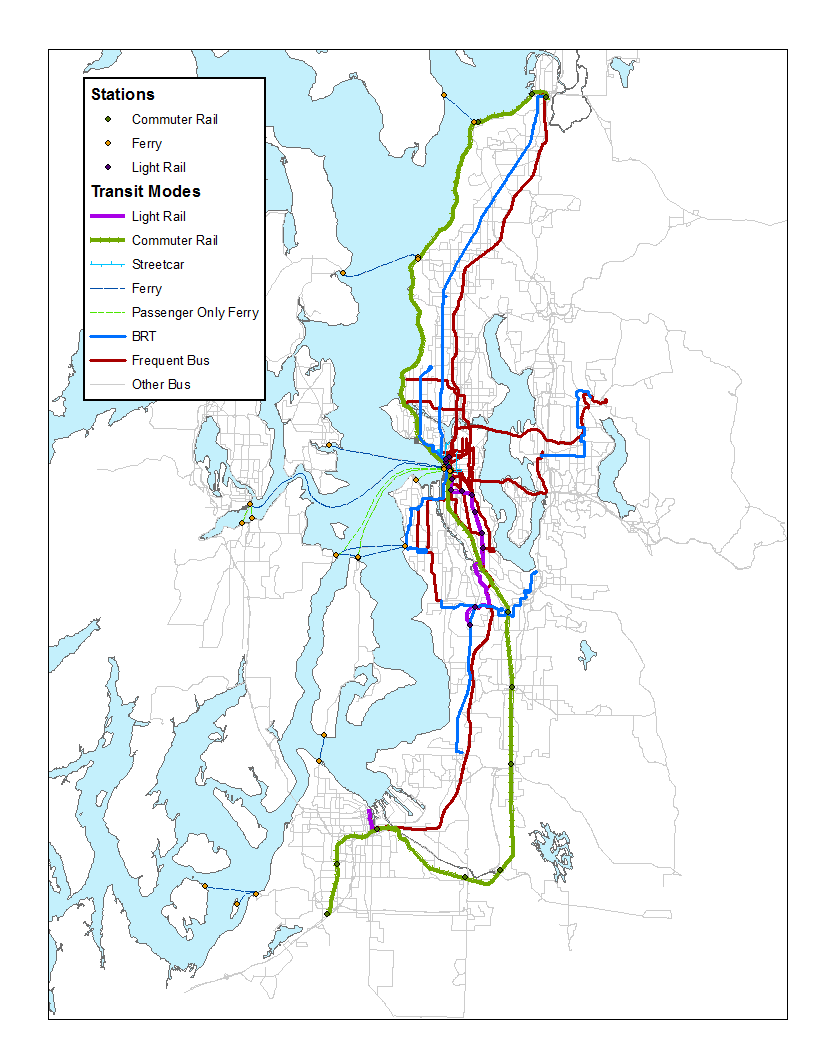 Puget Sound Rail, Ferry, BRT, and Frequent Bus Source: PSRC |
As of today, King County Metro, Sound Transit, Kitsap Transit and Pierce Transit have regularly updated GTFS data available, and Community and Everett Transit are working hard to make their data available in GTFS as well. The lack of data from the other agencies was not an issue for this analysis because those agencies have limited Sunday service. Having GTFS data from all regional transit agencies will facilitate our ability to do more comprehensive transit analyses in the future.
Post updated 11/21: graphic caption modified.