
Bicycling in the Puget Sound Region
It’s National Bike Month, an annual celebration of active transportation—and what better way to honor bike month than with some bicycle commuting data! Data shows that the number of bicycle trips is growing from coast to coast. We have recently completed our 2014 Regional Travel Study, so we can show you some interesting stats coming from the study.
In the Puget Sound Region, people make about 178,000 daily trips by bicycle, averaging about 4 miles a trip; this brings the daily region total to 711,000 miles biked. About 65% of these trips are by males, with people in the 25-34 year old age group representing the highest proportion of bike riders.
Where are people biking in our region?
Residents in the North Seattle-Shoreline district and the Seattle Central Business district have the highest bicycling mode share, as shown in the map below. North Seattle-Shoreline district likely contains the highest proportion of bicyclists given the proximity to the University of Washington (university commuters) and easy access to the Burke-Gilman trail.
PSRC organizes designated areas of density into regional centers. The regional center that generates the most bicycle trips by residents is First Hill/Capitol Hill with 6,700 daily bike trips generated by people living in that area.
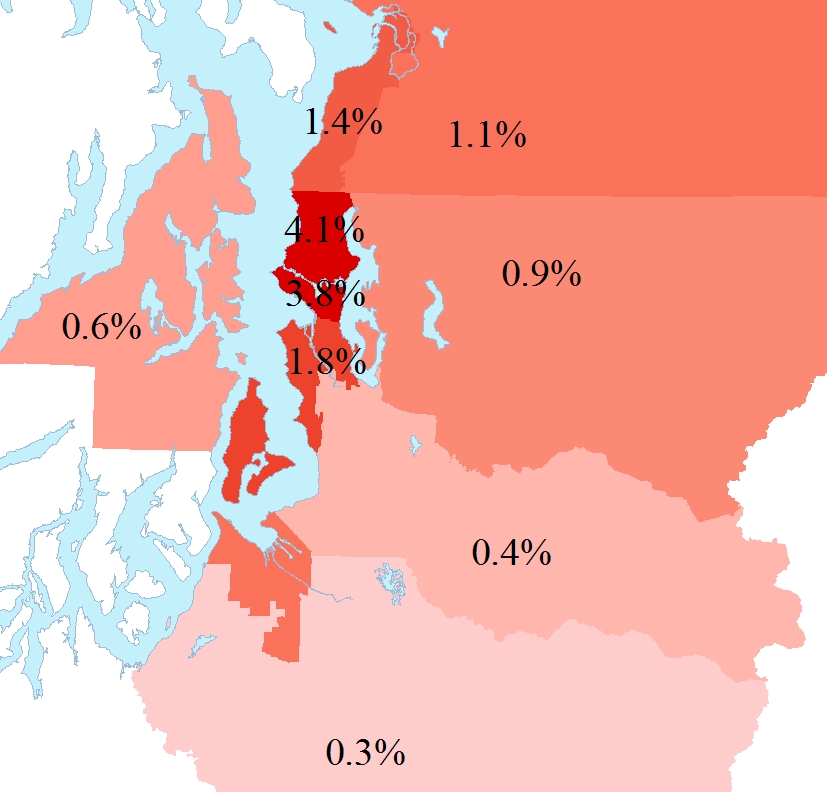 Percentage of trips made by biking by home location Source: PSRC 2014 Regional Travel Study |
Has mode share gone up? Why are people biking?
Since 1999, bike mode share has increased as a share of total trips by 44%. Much of that increase has occurred since 2006.
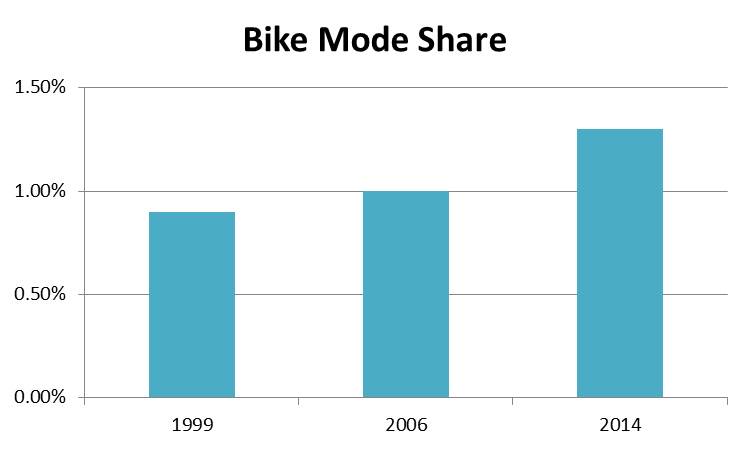 Bicycling mode share over time Source: PSRC Regional Travel Studies: 1999, 2006, 2014 |
The largest purpose people are biking for is work (39%). Exercise (19%) is the second largest purpose and school is the third largest (9%). There are a wide variety of other reasons (27%) people bike like visiting friends, going to a restaurant, or running an errand.
The survey also revealed that around 8,500 trips per day are made for biking to transit.
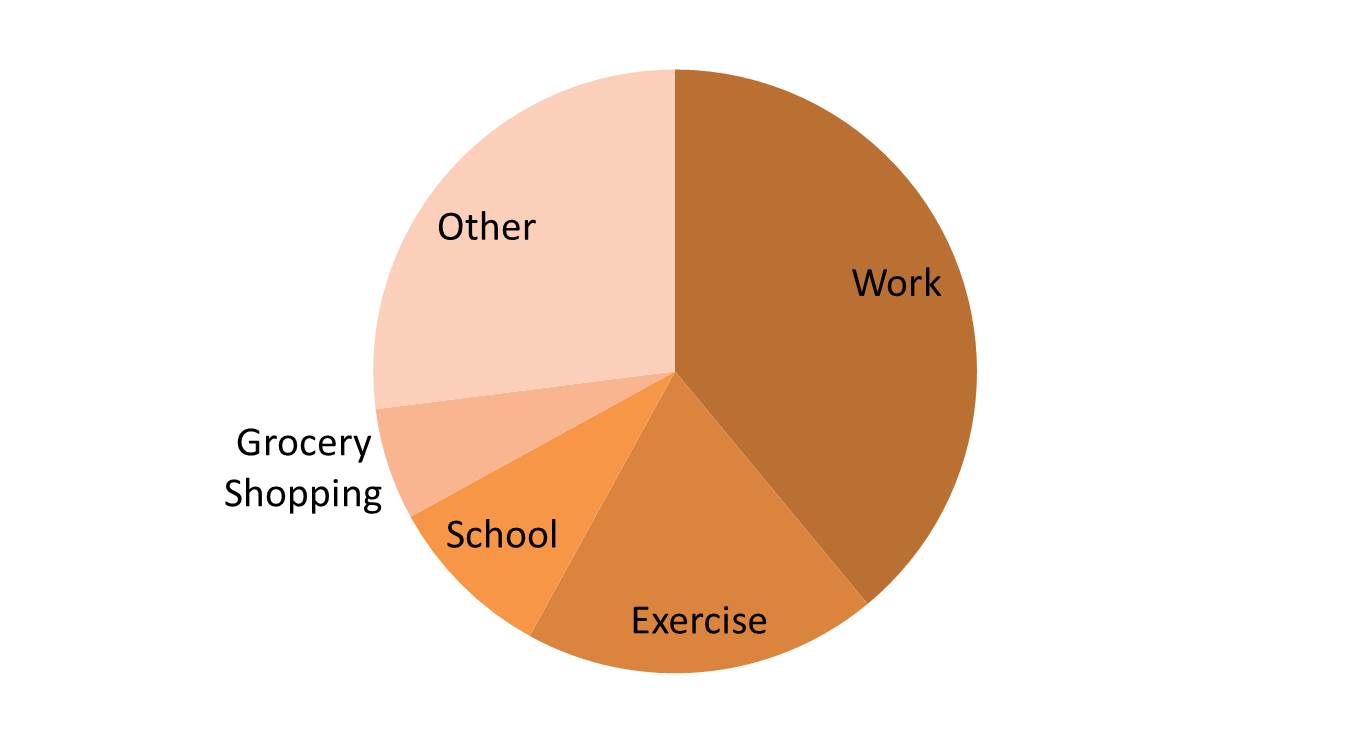 Bike trips by purpose Source: PSRC 2014 Regional Travel Study |
What else would you like to know?
National Bike to Work Month is a great way to raise awareness about bike commuting and safety, and to encourage participation; many people who participate in their Bike to Work Day/Month promotion as first-time commuters become regular bike commuters. Spread the word, share the data! Questions can be directed to PSRC data staff. This data was derived from the 2014 PSRC Regional Travel Study, and you can actually download the data yourself here: Download Page for Regional Travel Study.