Millennials, Baby Boomers, and Parents: Trends in Travel
filed under:
Young people are waiting until an older age to get their driver’s licenses according to a recent national study. We were wondering if the national research on driver’s licenses could be observed in the Seattle region in our recent 2014 household travel survey. So I started to dive into this question from household survey and it made me ask a bunch of other interesting questions! This blog post reflects the rambling data discovery process I conducted. I’ll take you on the journey with me.
Here’s the first question I had:
Question 1: In the Puget Sound Region, are fewer young people getting licenses in recent years?
Our last household survey was 2006, so we are comparing the driver’s license rates between 2006 and 2014.
The image below shows that the percent of 16 to 17 year olds with licenses did decrease from 55% in 2006 to 45% in 2014 in the Puget Sound Region. There is also a slight decline from 2006 to 2014 in the percent of people with licenses, until around age 35.
Interestingly, there is a slight trend towards older people hanging onto their driver’s licenses during that time period. For example, 95% of 65-74 year olds had licenses in 2014, as compared to 92% in 2006.
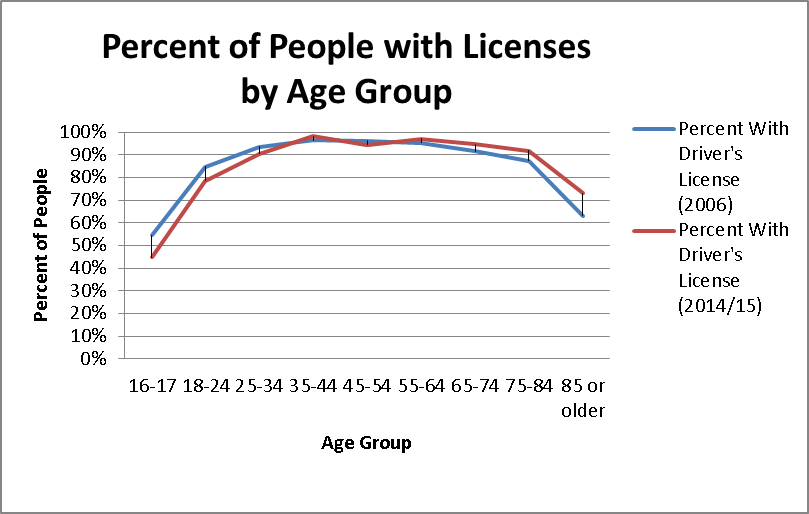 Percent of People With Driver's Licenses by Age Group Source: PSRC Household Travel Surveys 2006 and 2014 |
These differing trends between young people and older people made me wonder if the real factor in determining driver’s license ownership was worker status. Many jobs even require that a person has a driver’s license.
Question 2: Are young people working less and older people working more?###
The American Community Survey showed for the Puget Sound Region a decline in the share of 16-19 year olds working, from 38% in 2006 to 24% in 2014. Conversely the American Community Survey showed an increase in the share of 65-69 year olds working, from 31% in 2006 to 37% in 2014.
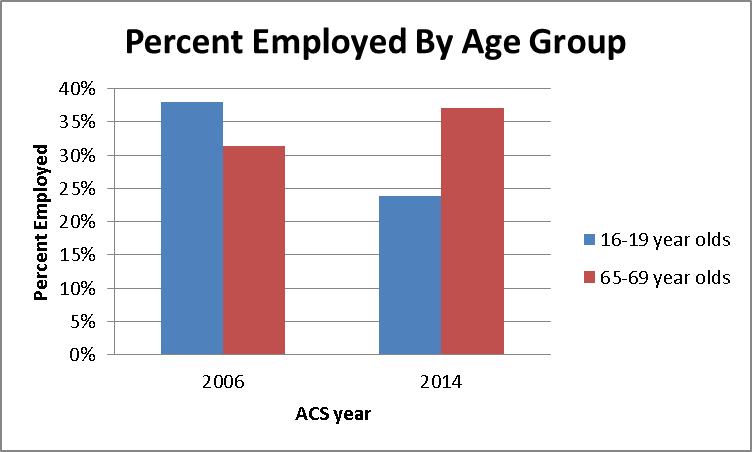 Percent of Age Groups that work Source: American Community Survey 2006 and 2014 |
Local workforce participation rates reflect national trends. Since the early 1990’s, teen employment rates have been declining, and the most recent recession has amplified that trend. In 1978, 58% of 16-19 year-olds had a summer job, while only 31% did in 2014. Conversely, older workers have remained in the workforce longer than expected, in many cases deferring retirement in reaction to the economic downtown of 2007-2009.
It’s interesting to see these employment trends by age alongside driver’s license trends. A greater share of people of an age group working correlates with a greater share of people of the age group having driver’s licenses, but rigorously proving that employment causes young people to get licenses would require much more econometric work.
Anyway, trends in licenses really only matter if peoples behaviors and travel choices are changing. So I asked the next question.
Question 3: Are more young people using transit? Are fewer older people using transit?###
I found this trend in transit by age group to be the most fascinating. Young people are using transit more, but so are middle aged people! You can see this in the image below.
Two groups stand out as outliers in the transit mode share trends: people age 35-44 and people over 65. People age 35-44 are using transit in about the same amount in 2014 as in 2006. Older people are using transit less, commensurate with more of them having licenses. There may be other reasons older people are using transit less. Why do you think people over age 65 have lower transit mode shares in 2014 than in 2006?
I was especially interested in the 35-44 year old group because I hadn’t ever seen that trend before.
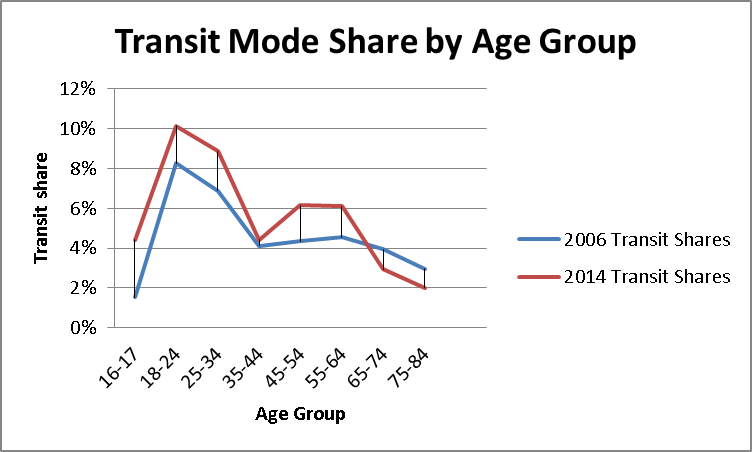 Transit Mode Share By Age Group Source: American Community Survey 2006 and 2014 |
Question 4: What is a potential reason that 35-44 year olds did not increase their transit use from 2006 to 2014?###
My hypothesis is that 35-44 year olds are most likely to have children in the household and this makes it more difficult to switch to transit. The chart below shows that people age 35-44 are the most likely to have children in their household.
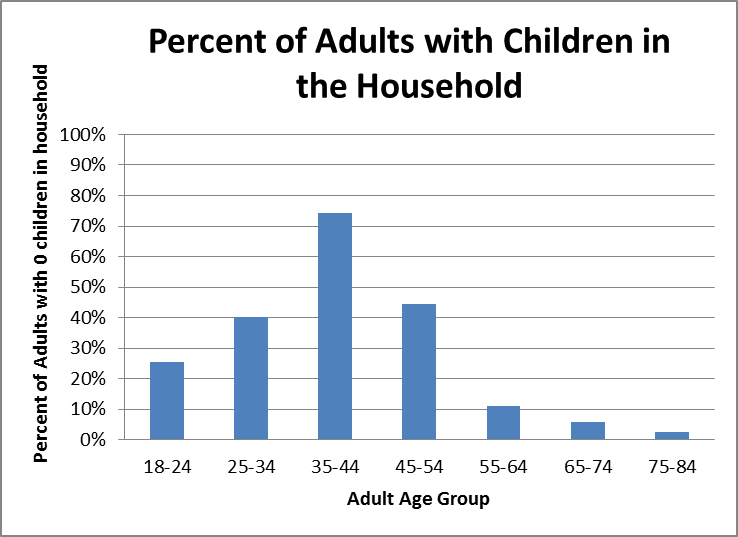 Percent of Adults with Children in Household Source: 2014 PSRC Household Travel Survey |
I happen to be in this age group and having my first child. Even though I’m a transportation planner, I’m wondering how easy it would be to bring my baby on the bus. The main reason is that the bus I ride is standing room only and people are smashed door to door in together and I don’t know how I’ll be able weave a baby in there!
Another reason that adults with children in the household may not use transit as much: child caretaker travel patterns tend to be complicated and may not be well-supported by a transit system. Finally, adults with children in the household have limited time and may not be able to spend the extra time on transit.
The image below shows that the number of children in the household has a strong negative relationship with transit mode share.
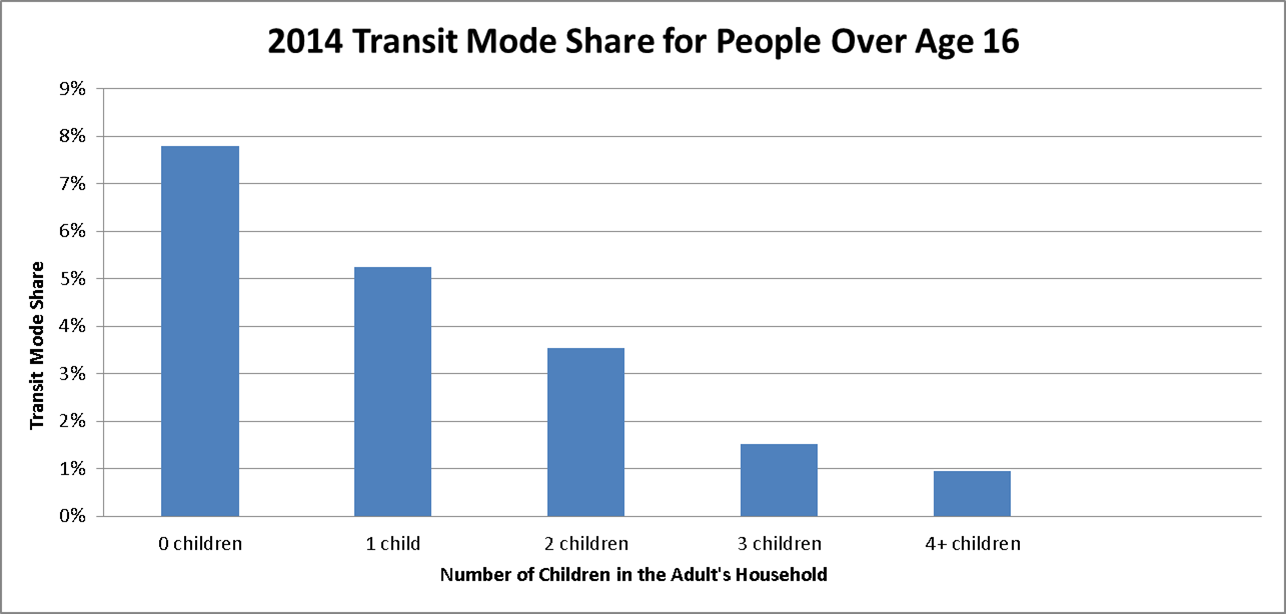 Transit Mode Share for Adults with Children in the household by number of children Source: 2014 PSRC Household Travel Survey |
Thanks for going on this data exploration with me where we found out that:
- Younger people are getting licenses later, and older people are holding onto licenses more than a few years ago.
- Fewer young people are employed and more older people are employed than a few years ago.
- Transit use is generally going up, except for those aged 35-44 and over 65.
- Adults with children in the household are much less likely to use transit than other adults.
I love household travel studies because they let you observe interesting trends and find things out you might have never guessed.