Biking in Seattle during COVID-19 time.
In the past couple of months, governments around the world implemented social distancing measures to slow the spread of COVID-19. During this unique time, we would like to understand how people’s travel behavior is changing. The first data point we wanted to analyze was the number of people bicycling for a couple of reasons:
-
The data is publicly available on the Seattle DOT website (link here);
-
Usually, May is the Bike Everywhere Challenge month in the PSRC region and Washington State (not this year, but we are hoping to participate next year);
-
Biking is one of the popular modes of getting to and within Seattle downtown.
Here are the questions we explored :
1. Have numbers of people biking decreased in March and April 2020 comparing to previous months/years?
2. Was there a decrease in biking after Work from Home or stay-at-home orders?
3. How has the people’s biking behavior changed?
Data
Seattle DOT has 12 bike counters providing bicycle and pedestrian counts on multi-use trails, streets, and greenways. The counts are available starting February 2014 to present, and most counts are updated once a month. Some of the trails don’t have March 2020 counts, hence in our analysis we wanted to focus on the trails that have March 2020 counts, including:
- Fremont Bridge
- Spokane Street Bridge
- 2nd Avenue at Marion St
- 2nd Avenue at Cedar St
- Burke Gilman Trail north of NE 70th St Bike and Ped Counter
- W 58th St Greenway at 22nd Ave NW Bike Counter
- Elliott Bay Trail in Myrtle Edwards Park Bike Count
- 7th Avenue and Blanchard St
- Westlake Avenue at Newton St
- 26th Avenue Greenway
- MTS Trail west of I-90 Bridge Bicycle and Pedestrian Counter
- Broadway Cycle Track North Of E Union St Bicycle Counter
Analysis
1. Have numbers of people biking decreased in March and April 2020 comparing to previous months/years?
To understand if the number of people biking changed, we’ve calculated a percentage change of bicycle counts in March and April (2019 vs 2020).
| Trail Name | March 2019 vs 2020 Delta, % | April 2019 vs 2020 Delta, % |
|---|---|---|
| Broadway and E Union St | 2.26 | -20.2 |
| Burke Gilman | -5.0 | 65.5 |
| Elliot Bay | -21.8 | 20.4 |
| 26th Ave Greenway | -24.4 | 10.8 |
| NW 58th Greenway | -30.9 | -19.8 |
| Fremont Bridge | -32.3 | -25.7 |
| Spokane Bridge | -33.2 | -2.1 |
| MTS Trail | -36.7 | 41.6 |
| 2nd Ave and Cedar | -46.4 | No data available |
| 2nd Ave and Marion | -50.2 | -68.6 |
Note: the counter at 7th Avenue and Blanchard was not included because the counter started collecting data in August 2019. Westlake and Newton counter was also excluded because of data quality.
As expected, the bicycle counts declined on all trails/streets except for Broadway and E Union Street location in March 2020 when compared to March 2019. Some areas like Seattle Downtown and Belltown having a steeper decline (2nd Avenue and Marion and 2nd Avenue and Cedar) and some trails have a more shallow decline (Burke Gilman and Elliot Bay trails). In April, there is a different picture where recreational trails Burke Gilman, Elliot Bay, MTS trail, and 26th Avenue Greenway saw growth in bicycle counts when comparing to April 2019.
2. Was there a decrease in biking after Work from Home or stay-at-home orders?
On March 4th, the King County officials gave the recommendation to work from home to the companies, and government agencies and tech firms advised their employees to work from home. Stay-at-home order was placed by the Washington State on March 23rd. The next two figures show February-March 2020 bicycle counts for two different types counter locations: Downtown/Belltown (2nd Ave and Marion St; 2nd Ave and Cedar St) and trails (Burke Gilman and Elliot Bay trails). These four counters will represent commute biking routes and recreational routes respectively.
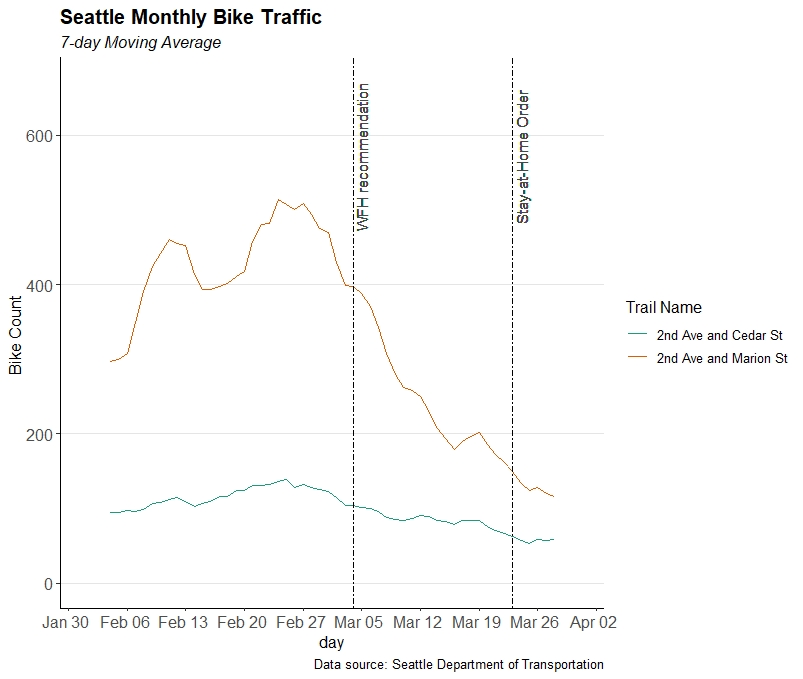 |
Bicycle counts in Downtown/Belltown started decreasing at the start of March, right after Washington State and King County’s work from home recommendation. The downward trend continued after the stay-at-home order. The bicycle count decline along commute-heavy routes was expected and not surprising.
 |
The Burke Gilman and Elliot Bay trails didn’t see such a steep decline in bicycle counts. Moreover, the highest bicycle counts occurred after the work from home recommendations and went down after the stay-at-home order. An interesting shift occurred in bike counts between the Burke Gilman and the Elliot Bay trails. In February 2020, bike volumes were higher on the Elliot Bay trail than on the Burke Gilman. Generally, bike counts on Elliot Bay trail were higher during weekdays vs weekend - this suggests that this trail was mostly used for commuting in February 2020. In the middle of March 2020, Burke Gilman trail saw bike counts growth that exceeded bike count on Elliot Bay trail.
3. How has the people’s biking behavior changed?
To explore the behavior change question, we decided to look at the average day in April 2019 and April 2020 for the counters with available data for April 2020, which includes Burke Gilman, Elliot Bay, Fremont Bridge, and Spokane Bridge.
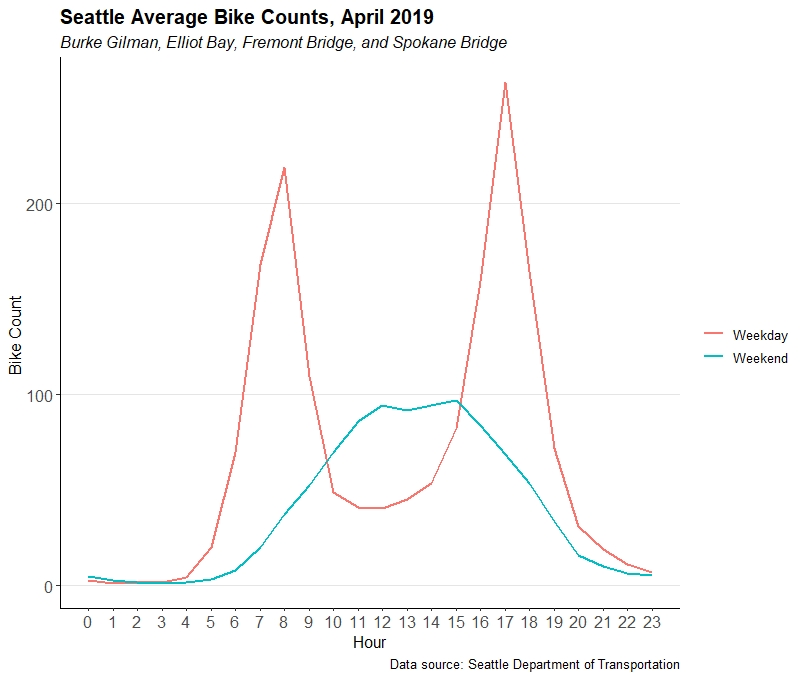 |
In April 2019, there are two peaks during a weekday: one in morning (around 7-8AM) and another one during evening (around 6PM). This pattern represented a typical commute for people when peaks were before/after 9am-5pm working schedule, and each peak is no longer than one hour. A typical weekend had one peak starting from 12pm to 3pm.
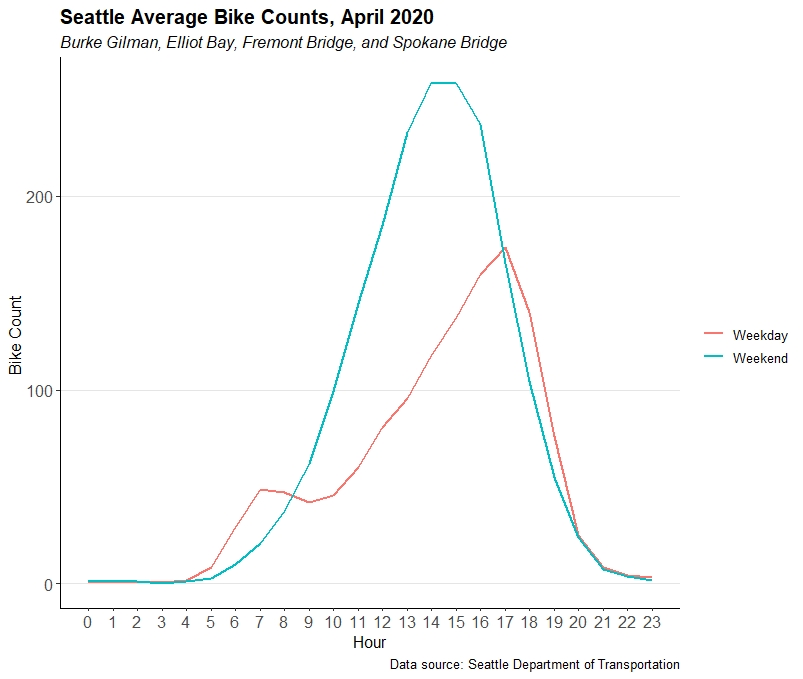 |
In April 2020, when the majority of people don’t have to travel to an office, weekdays’ patterns look quite different from April 2019. There is one pronounced peak around 6pm during a weekday in April 2020. The bicyclist might be talking biking trips or exercise trips after work. In general, there are not that many people who bike on a weekday compared to a weekend.
Results
The biking patterns have changed during COVID-19. At first, in March, the number of people bicycling collapsed along commute-oriented routes such as ones in Belltown and Downtown, while a decline in bicyclists was not that steep along Burke Gilman and Elliot Bay trails. In April, the number of bicyclists skyrocketed on Burke Gilman and Elliot Bay trails comparing to April 2019 number. The weather might be one factor - April was warmer with less precipitation this year.
Peoples’ biking behavior is changed as well - you will see more bikers during a weekend than on a weekday. There are no typical 8AM and 6PM peaks during the weekdays, but one 6PM peak.