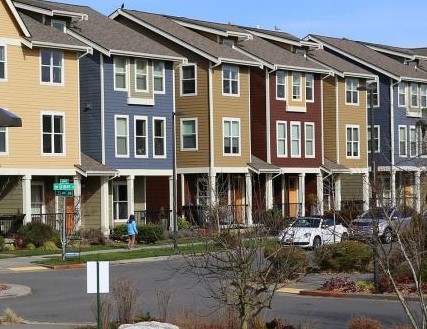
Why are people displaced from their homes? Correlations abound, but prediction is never easy.
filed under:
In the Seattle region, sky-rocketing housing prices, a legacy of discriminatory housing policies, and new transportation infrastructure, have all coalesced together to have the potential to displace people from their homes.
The Puget Sound Regional Council (PSRC) and the City of Seattle have been trying to understand displacement risk in our region. PSRC has developed a displacement risk index map to better identify places where people are at heightened risks for displacement.

Puget Sound Regional Council Displacement Risk Mapping
In PSRC’s 2019 household travel survey, residents were asked the reasons they left their previous residence. Data analysts at the City of Seattle and PSRC hope to better understand where displacement is occurring in the region using this data.
At PSRC, we have a team of analysts digging deep into this question of who is displaced. As we began looking into the relationships between single variables such as race, age, employment status, or income with displacement, it seemed to make sense to examine potential contributors to displacement more holistically within a model. The PSRC data team certainly doesn’t have all the potential predictive variables for displacement, but we have a lot of data lying around at PSRC, so I thought I’d take a shot and see what I could mine out of the data we have.
I chose to estimate a logistic regression model to identify which characteristics were most explanatory in determining a household’s displacement. The 2019 travel survey asked residents who had moved within the past five years the reasons they had moved. Only one member of the household would answer this question. Households which selected one or more of the following responses were labeled as displaced, and otherwise they were labelled as not displaced.
Displacement-Related Reasons for Moving
- Housing Cost: Could no longer afford previous residence because of an increase in rent or
- Income: Could no longer afford previous residence because of a change in income or finances
- Community: Friends, family, or cultural community were leaving the area
- Forced: Forced to move out (e.g., building demolished or renovated, asked to leave by landlord, foreclosure)
Displacement Estimation
The R library glm was used for the estimation. The code I used for model estimation can be found here. I’ve used many estimation packages in my day but I found the R glm library to be very friendly. One thing I struggled with during estimation is that I love using python pandas to manipulate data and I’m sorry, R, but dplyr and data.table just can’t compare for me.
Table. Residential Displacement Logistic Regression Results
| term | estimate | std.error | statistic | p.value |
|---|---|---|---|---|
| (Intercept) | -2.28 | 0.37 | -6.1 | 0 |
| Household Income Under $25,000 | 1.7 | 0.18 | 9.45 | 0 |
| Household Income is in the range $25,000-$99,999 | 1.04 | 0.11 | 9.57 | 0 |
| Household Has less Cars than Adults | 0.98 | 0.29 | 3.41 | 0.000642 |
| Previous Home was Rental | 0.73 | 0.13 | 5.6 | 0 |
| LN(Distance to Light Rail from previous home) | -0.09 | 0.03 | -3.16 | 0.001564 |
| Household contains at least one non-Hispanic White Member | -0.31 | 0.11 | -2.73 | 0.006379 |
| Previous Home was Located in Seattle | -0.93 | 0.18 | -5.14 | 3.00E-07 |
The model indicates that greater displacement is associated with (in descending order): household income, car ownership, renting as opposing to owning, being all people of color, living closer distance to light rail, and living outside Seattle.
I tried many land use and travel variables in the model, as shown above, but the only one that was significant was the distance to light rail. As expected, the income variables were the most explanatory. I was somewhat surprised to see the magnitude and significance of the variable about being located in Seattle. Seattle has strong renter protection laws than other places in the region.
The variable related to race was a tricky one to construct. How can you express the race of a household succinctly with limited data? The data is very thin for African-American households unfortunately. So I tried various aggregations of person racial categories such as Asian Only, non-Hispanic White Only, and African-American, Hispanic, Multiracial and other. Then somehow, I had to group the households into buckets, which wasn’t easy either because of the diversity within households as well. The variable that I ended up finding was significant was if a household contains at least one non-Hispanic white member, then the household is less likely to be displaced. I’d be interested to hear people’s thoughts on why this variable formulation worked best.
The pseudo-R-squared (McFadden, 0.10) of the model may indicate the variables in the model have limited explanatory power. A lower pseudo R-squared can be okay (as compared to R-squared) for explaining variable relationships to outcomes, as we are here, but I still wonder what isn’t being accounted for in the model. Then I started wondering if there was a better goodness-of-fit measure for a logistic regression. The self-proclaimed “Stats Geek” said that the Hosmer-Lemeshow goodness of fit test is appropriate for logistic regressions. The Hosmer-Lemeshow goodness of fit test resulted in the following measures: Apparently, a well-specified model has a p-value greater than 0.05, and the p-value for the the Hosmer-Lemeshow test was 0.89 so it looks like the model is well-specified.
Give me some ideas on this model!
Anybody got ideas on how to improve this model? How could I use it in the planning process? What variables are we missing? Do we just need more data? Is it problematic that how we have defined displacement? Is the model form itself a problem?

