The Uncertain Future of Automated Vehicles
filed under:
“How will automated vehicles impact the transportation system?” It’s been a popular question this year for transportation planners. Will automation be the magic bullet that solves congestion? Will it induce sprawl?
The only honest response we can provide now is that “we don’t know.” Of course we don’t know how an automated future will look! Vehicle automation is still very early in development. We don’t know how successful it will be, how affordable, how popular, or how it will change over time. We don’t know if people will own their own robot cars or rent them like taxis, if they will be able to operate safely at 150 mph, or how safely they interact with pedestrians and cyclists. We don’t know if only a few rich people will buy them or if everyone will. We don’t know if parents will be comfortable dropping their children into them without supervision. We don’t know how our roads will be paid for in the future, whether that will be fuel taxes, tolling, or a tax on miles driven. It would be irresponsible to make any definitive statements about how automated vehicles will impact our roads, such as “they are going to solve our traffic problems.” So, our answer is still “we don’t know.”
However, as travel modelers we have an obligation to address uncertain questions like this as best we can. Uncertainty is not a new concept for us; modelers regularly wrestle with major technological and cultural changes like the introduction of automated vehicles. For example, twenty years ago, no one seriously anticipated we would all walk around with phones more powerful than computers in our pockets. Smart phones provide real-time information and affect travel choices; in the latest 2014 household travel survey, we found that 42% of people change their time of departure based on real-time information about travel conditions. That’s a major technological development that was not anticipated by travel forecasts. There are also some technologies that don’t develop quite as expected. Electric vehicles for instance haven’t penetrated the market as expected (not to mention flying cars). By the way, people are still working on flying cars, apparently:
 Flying Car at New York International Auto Show 2012 Source: Anthony22 at en.wikipedia.org |
So, there are often many things modelers don’t know. When we’re uncertain about the the future, we consider a range of possibilities to identify a set of most-likely outcomes. We understand human behavior and transportation systems well enough that we can design rational scenarios to evaluate potential automated vehicle impacts. For example, in any future scenario, people will continue responding fairly rationally to prices; as the price for transportation rises, people travel shorter distances or less frequently. Automated vehicles will not change this phenomenon, so we can make some educated guesses about how people will react to different pricing contexts. We also know that people perceive their actual travel time differently depending on level of comfort and amenities, which may be very different in automated vehicles.
Defining Scenarios
Unknown trip costs and murky values of time mean we need to test the upper and lower bounds of these variables to evaluate a range of possible futures. For instance, we can test a situation where all automated cars are incredibly efficient, dramatically reduce congestion, and reduce personal vehicle ownership all at the same time. What would our region look like in this extreme scenario? Conversely, we can evaluate a world where automation just induces a lot more driving, with longer trip lengths. Just how many more miles might we be driving in that world?
We recently explored four potential futures like these in a paper for the Transportation Research Board. The four scenarios are based on different permutations of:
-
road capacity improvements (reflects more efficient, synced vehicle fleets)
-
perceived travel time reductions (riding is more tolerable than driving)
-
parking cost reductions (automated vehicles can seek parking on their own)
-
price per mile increases (infrastructure management costs or taxi-like service charges)
The table below describes the scenarios, concepts, and variable changes.
| Scenario Number | Description | Technical Details |
|---|---|---|
| 1 | AVs increase network capacity. | 30% Capacity Increase on Freeways, Major Arterials |
| 2 | Important trips are in AVs | 30% Capacity Increase on Freeways, Major Arterials Travel time is perceived at 65% of actual travel time for high value of time household trips($24/hr.) |
| 3 | Everyone who owns a car owns an AV. | 30% Capacity Increase on Freeways, Major Arterials& Travel time is perceived at 65% of actual travel time for all trips & 50% Parking Cost Reduction |
| 4 | All cars are automated and priced per mile to recoup the entire cost of the road network. | Cost Per Mile is $1.65 |
Results from Scenario Testing
In scenarios with increased capacity, both accessibility and vehicle miles traveled increased. More efficient automated vehicles reduced congestion in these scenarios, which spurred more people to drive, taking advantage of the clearer roadways. However, in these scenarios, delay hours increase for some and decreased for others, depending on the number of automated vehicles on the road and travel time perceptions. This suggests that “capacity increase” from automation might offset increased demand, but only to a point. An interesting finding was that miles travelled increased not because of more trips being taken, but because the existing trip lengths are longer.
In Scenario 4, a dramatic pricing scenario was considered for an all-automated vehicle network, at a cost of $1.65 per mile. This scenario produced results counter to the first three scenarios; vehicle miles and delay dropped drastically, and transit use increased substantially. Here are some key results compared across scenarios.
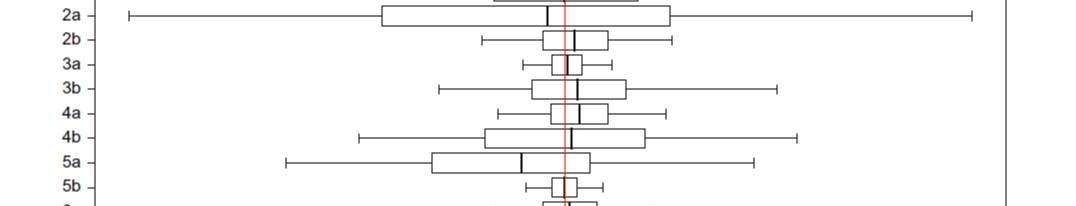
| Measure | Value | Base | Alt 1 | Alt 2 | Alt 3 | Alt 4 |
|---|---|---|---|---|---|---|
| Trips | Trips/Person | 4.1 | 4.2 | 4.2 | 4.3 | 4.1 |
| Distance | Average Trip Length | 6.9 | 7 | 7.2 | 7.9 | 5.8 |
| Distance | Work Trips | 12.4 | 12.9 | 12.9 | 20 | 11.5 |
| Distance | School Trips | 5.8 | 5.8 | 5.8 | 6.7 | 4.7 |
| Speed | Daily Average | 27.9 | 30 | 29.9 | 28.4 | 30.4 |
| Mode Share | SOV Share | 43.7 | 43.7 | 42.7 | 44.8 | 28.7 |
| Mode Share | Transit Share | 2.6 | 2.7 | 2.7 | 2.4 | 6.2 |
The map below shows the increase in vehicle miles traveled when comparing the base scenario to Scenario 3. This scenario assumes that driving is easier (increased capacity), cheaper (lower parking costs), and more enjoyable (perceived travel time decreases) for all users, leading to a jump in accessibility benefits directly through personal vehicle trips. Though many Puget Sound residents would enjoy higher accessibility in this scenario, total VMT climbs nearly 20%, possibly compromising the region’s goals of reducing greenhouse gas emissions and containing growth into existing urban areas. Figure 3 shows how these VMT increases are dispersed across the region.
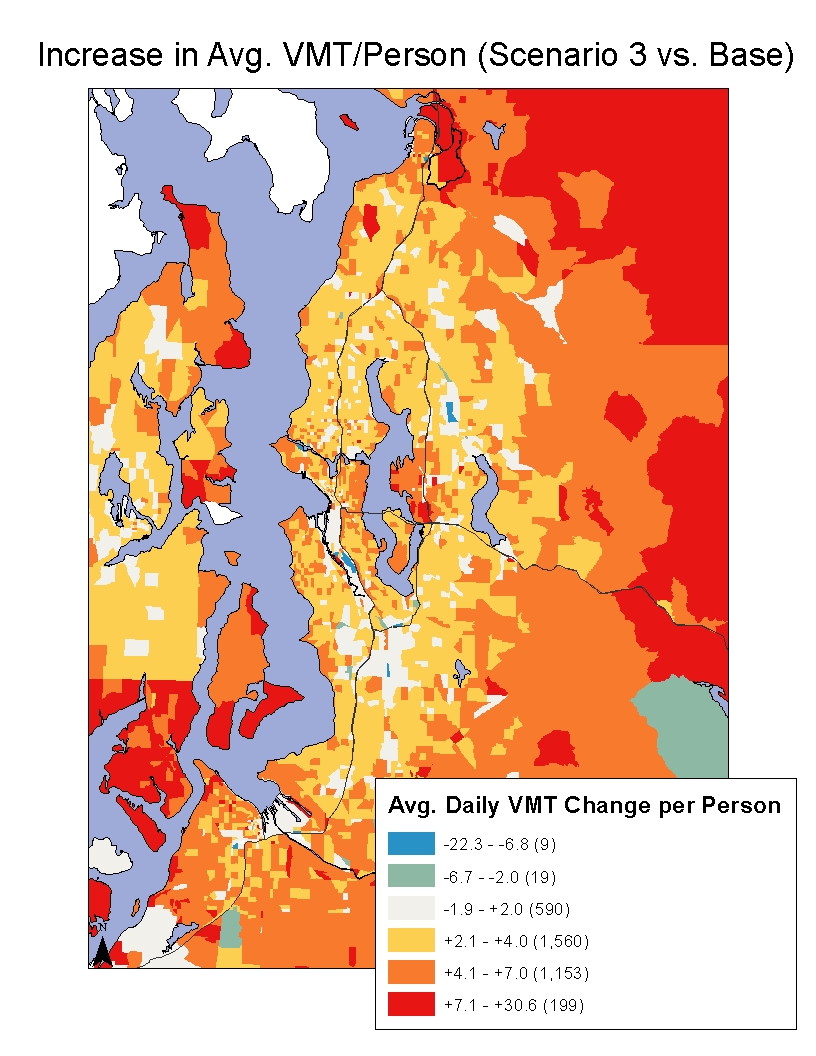 Vehicle Miles Traveled Change Scenario 3 vs Base. Source: SoundCast: PSRC activity-based travel demand model |
This result indicates that average VMT per person in nearly all zones would increase, with the most extreme increases occurring in outlying areas, and even in some core zones of central Seattle and Bellevue. Zones showing reduced VMT are generally sparsely populated; results for those areas are less reliable. Improving regional mobility is one of PSRC’s goals, but such improvements made through increased personal vehicle trips may be conflicting with environmental and land-use targets.
Next Steps
Let’s step away from the mesmerizing numbers and maps and get back to the point. If we vary the input assumptions to the model based on plausible outcomes resulting from automated vehicles, strikingly different transportation futures will emerge. The field needs to gather data before accurate forecasts can be made.
Given this research, what should we do next?
Our existing models are insufficient, but exploring how they function in the above scenarios has really helped highlight where improvements need to be made. Until hard data exists on how this new technology rolls out are forced to make some broad assumptions about price and service levels. In the meanwhile, here are some improvements we’d like to get in place soon.
- Travel modelers need to develop a better understanding about how new technology like smartphones, car sharing, and real time travel data is currently impacting travel choices.
- We need to conduct a “stated preference” survey to understand how people think they will respond to automated vehicle systems when they arrive.
- A new “automated vehicle” mode that accounts for its unique service characteristics should be added to our mode choice models, and possibly to route choice as well.
- Taxi-like services and other shared-ride options probably need to be modeled better too, either with a taxi mode or with extensions to the existing shared-ride capabilities.
There is plenty more work to be done here! We look forward to more researchers jumping into the fray on this fun topic.
Download: