R Fundamentals II
Homework
Challenge 1
The paste function can be used to combine text together, e.g:
best_practice <- c("Write", "programs", "for", "people", "not", "computers")
paste(best_practice, collapse=" ")
[1] "Write programs for people not computers"
Write a function called fence that takes two vectors as arguments, called text and wrapper, and prints out the text wrapped with the wrapper:
[1] "*** Write programs for people not computers ***"
Note: the paste function has an argument called sep, which specifies the separator between text. The default is a space: " “. The default for paste0 is no space”".
Challenge 2
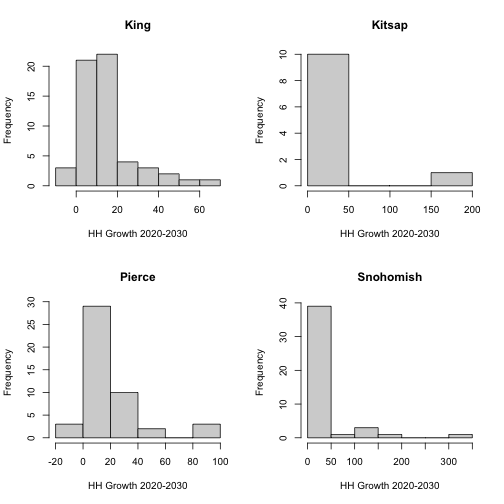
Can you write a for loop that reproduces the following 4-panel plot of growth rate from 2020 to 2030 for the four counties?
 Hint: See the Saving Plots section on creating a 2x2 graph panels.
Challenge 3
Prepare for the next module by installing the required packages: tidyverse, openxlsx, scales, plotly, reshape2, lubridate, htmlwidgets
